
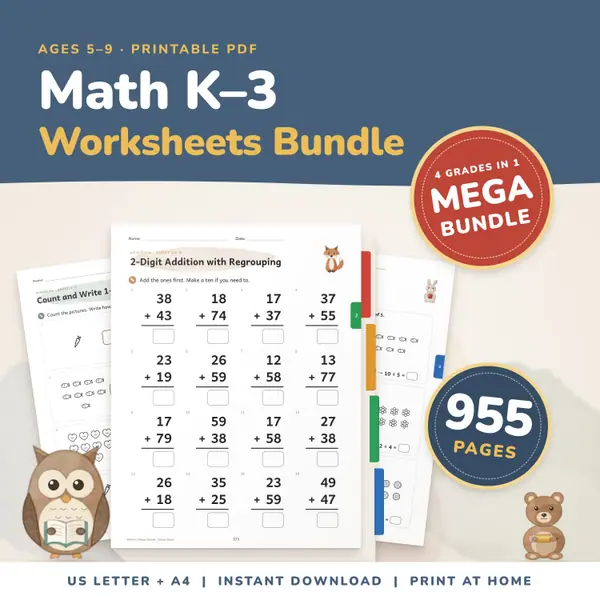
Math Worksheets Bundle K-3
955 pagesUS Letter + A4Kindergarten to 3rd gradeEnglish
See price and buy on EtsyType your categories, such as favourite fruits, and press the plus button each time someone votes. The tool draws tally marks in groups of five with a strike through each group and adds up the totals for you. Switch between a bar graph and a pictograph, edit the title and axis labels, then print the table with the graph or a blank survey sheet.
Free to use, no sign-up. Everything runs in your browser: nothing you type is uploaded.
Type a title, then rename the rows to the choices in your survey, for example apple, banana, grapes and orange. Press Add a category for more rows, up to ten, and the little x removes one you do not need.
Press the plus button beside a category each time a child answers. A mark appears in the Tally column, four lines and then a strike across them to make a group of five. The minus button fixes a slip.
The totals are counted automatically and a bar graph grows beside the table. Switch to Pictograph to see a row of symbols for each category, and change the axis labels to match your question.
Print the table with the graph for the maths book or the wall. Print the blank survey sheet so every child can collect their own tallies. Full screen shows the tally big on a class screen.
Ask the class about favourite pets, ice cream flavours or how they came to school. Open the tool on the class screen, add a mark for each hand that goes up, and let the children read the finished graph aloud.
Count sunny, cloudy and rainy days for a month, or the birds seen at the window. Keep adding marks day by day and compare the bars at the end. It fits neatly into a science or nature study week.
Young children learn to count in fives with the tally strike. Older children compare the bar graph and the pictograph and talk about scales. A maths worksheet pack or a full year curriculum covers the same data topic on paper.
Roll a die thirty times and tally the sixes, fives and the rest. The bar graph shows whether the dice are fair. The same sheet records the scores of a family game night.
955 pagesUS Letter + A4Kindergarten to 3rd gradeEnglish
See price and buy on Etsy2,289 pagesUS Letter + A4Kindergarten to 3rd gradeEnglish
See price and buy on EtsyYes. It is free for teachers, parents and children, with no account or sign-up, and you can print as many tables, graphs and survey sheets as you like.
Each mark is a short vertical line. The fifth mark is drawn as a strike across the four before it, so a group of five is easy to see and count in fives.
Yes. Print table and graph puts the tally table and the graph you are showing on one page. Print blank survey sheet gives a page with empty tally boxes and an empty graph grid to colour.
Your categories and marks stay in this browser on your own device. Nothing is sent anywhere. They are kept for your next visit, and Start counting again sets every count back to zero.
More free tools
All toolsPickers and chanceClassroom screenMath makers and calculatorsWord and spelling toolsPrintable makersPlanning and tracking
Copy this code into your class page or blog. The tool is free; the small link under it tells your visitors where it comes from.
Updated